Learn how to contribute useful code to the individual explorer tab, by topic.
Integrate New Events in Individual Explorer
This tutorial will walk you through how to add / display additional events on the Individual Explorer Tab. Currently, the app supports events from ADMH, ADAE, ADCM, ADSL, ADLB, and ADLBC. You’ll note that most are occurrence (OCCD) class data sets which are designed to be date-oriented with the exception of ADSL, ADLB, & ADLBC. Regardless of data set class, the events tab’s module extracts important dates that you (the developer) chooses from any data set for display.
When incorporating a new date / data set into the events module you’ll not only need to consider additional UI elements, but there are two R functions to become familiar with which are introduced below.
UI considerations
In mod_indvExp_ui.R, the input called “checkGroup” &
“overlay_events” are introduced to the app’s user interface. The former
is for the Events tab and the latter is for the
Visits tab.
# Events Tab
checkboxGroupInput(
  inputId = ns("checkGroup"),
  label = "For additional patient events, load an AE, LB, LBC, CM, or MH",
  choices = c(" "),
  selected = NULL,
  inline = TRUE
)
# Visits Tab
checkboxGroupInput(
  ns("overlay_events"),
  label = HTML("<br/>Overlay Events:"),
  choices = c(" ")
)
Later, these values will get populated with server side logic that
depends on what the ADaMs the user uploads & the USUBJID selected.
That logic can be found in mod_indvExpPat.R and a snapshot
is shown below. To summarize, the code checks if a supported ADaM
exists, and if it does, that ADaM is assigned an domain abbreviation to
be fed to the choices argument for our two inputs:
checkGroup and overlay_events. Notice how overlay_events only receives a
subset of these choices, because Labs and Medical History aren’t
terribly valuable vertical lines to overlay on the Visits
tab.
# update checkboxes on both Events and Visits Tabs
# Initialize
checked1 <- NA
checked2 <- NA
checked3 <- NA
checked4 <- NA
checked5 <- NA
mh_names <- NA

# check for "adsl" (required), "adae", "adcm", and "adlb"
if ("ADSL" %in% loaded_adams()) { checked1 <- "DS" }
if ("ADAE" %in% loaded_adams()) { checked2 <- "AE" }
if ("ADCM" %in% loaded_adams()) { checked3 <- "CM" }
if ("ADLB" %in% loaded_adams()) { checked4 <- "LB" }
if ("ADMH" %in% loaded_adams()) {
  # For ADMH, we want to create separate checkboxes for each type of
  # Medical History Category that exist in the ADMH for the selected patient.
  mh_names <-
    datafile()[["ADMH"]] %>%
    filter(USUBJID == input$selPatNo) %>%
    distinct(MHCAT) %>%
    pull()%>%
    stringr::str_to_title()
  checked5 <- paste0("MH_",sapply(strsplit(mh_names, " "), function(x){
    toupper(paste(substring(x, 1, 1), collapse = ""))}))
}

# Combine all into a list
choices <- as.list(unlist(c(list(checked1,checked2,checked3,checked4,as.list(checked5)))))
names <- c("Milestones","Adverse Events","Concomitant Meds","Labs",mh_names) # ac: labels

# build a named list & Remove NULLs from the list
choices <- setNames(choices,names)
choices <- choices[!sapply(choices,is.na)]

# update the checkbox group
updateCheckboxGroupInput(
  session = session,
  inputId = "checkGroup",
  choices = unlist(choices),
  selected = NULL,
  inline = TRUE)

#######################################
# Version for vlines on Visits Graph
#######################################
# You can only overlay Milestones, Adverse Events, and Con Meds (currently)
choices2 <- as.list(unlist(c(list(checked1,checked2,checked3))))
names2 <- names[1:3]

# Setting up colors too
vline_eventtype_cols <- my_cols[1:3] # my_cols defined in utils_strObjs.R
v_event_cols <- setNames(vline_eventtype_cols,names2)
dashes <- c("solid","dotted","dashed")
v_event_lines <- setNames(dashes,names2)

# build a named list & Remove NULLs from the list
choices2 <- setNames(choices2,names2)
choices2 <- choices2[!sapply(choices2,is.na)]

updateCheckboxGroupInput(
  session = session,
  inputId = "overlay_events",
  choices = unlist(choices2), # optionally convert list to array
  selected = NULL)
Notably, to add another date-oriented data frame into the mix, you
(the developer) will need to add an additional checkedx
where x is the next sequential number of “checked” objects.
For example, if your data set is called “ADMD” where “MD” is the
abbreviation for “My Data”, then you’d need to add these chunks of code
into their respective positions above:
checked6 <- NA

# ...

if ("ADMD" %in% loaded_adams()) { checked6 <- "MD" }

# ...
choices <- as.list(unlist(c(list(checked1,checked2,checked3,checked4,as.list(checked5),checked6))))
names <- c("Milestones","Adverse Events","Concomitant Meds","Labs",mh_names, "My Data") # ac: labels

# ...

choices2 <- as.list(unlist(c(list(checked1,checked2,checked3,checked6))))
names2 <- c(names[1:3],"My Data")
Note that adjusting the objects choices2 &
names2 are optional; only adjust if you (the developer) or
subject matter experts (SMEs) deem it’s appropriate to overlay these
types of events on the plot in the Visits tab.
Standardize the format of your Event data
Now that the groundwork has been established, it’s time to introduce
the function called org_df_events() which has various (well
documented) arguments in the
mod_indvExp_fct_organizeEvent.R file. This function takes a
data set and manipulates it into a standard form. After being
standardized, the app can (and will) combine it with other standardized
event data frames as necessary.
What It Does
Essentially, this function uses lots of shiny inputs to execute the following (among other things):
- Validate that the date variable(s)-of-interest exist in the data set provided
- Selects the preferred date variable, allowing for back-ups in case the user uploads a data set where that date variable doesn’t exist
- Toggles the data source if advanced pre-filters exist
- Filters to a specific USUBJID and non-missing date variable
- Evaluates an expression to display a custom event Description based on other columns in the data set
- Produces a tidy tibble, in a standard format
An Example
In the example below, an Adverse Events (ADAE) is standardized using
org_df_events(). The arguments that are pre-fixed with mi_
all come from shiny, but below they’ve been populated with examples to
show the typical values they accept. That said, when implementing a new
events data set, you (the developer) will need to concern yourself with
the first 6 arguments, all of which are well documented on the
function’s help page.
  ae_dat <- org_df_events(
      df_name = "ADAE"
    , df_domain_abbr = "AE"
    , df_desc = "Adverse Events"
    , df_st_date_vars = c("AESTDT","ASTDT")
    , event_desc_vars = c("AEDECOD","AESEV","AESER")
    , event_desc = 'paste0(AEDECOD, ", AESEV: ", AESEV, ", AESER: ", AESER)'
    , mi_input_checkbox = c("DS","AE")
    , mi_input_apply_filter = FALSE
    , mi_usubjid = "01-701-1015"
    , mi_loaded_adams = c("ADSL","ADAE")
    , mi_datafile = list(ADSL = adsl, ADAE = adae)
    , mi_filtered_dat = filtered_dat
  )
What’s absolutely imperative when calling this function is that the
df_domain_abbr matches the values for the named-list of
choices passed to the updateCheckGroupInput() function used
to update input$checkGroup and
input$overlay_events discussed in
UI Considerations.
Running a publicly available ADAE data set (available through PHUSE’s
gitHub) through org_df_events(), the output
ae_dat might look something like the data frame below.
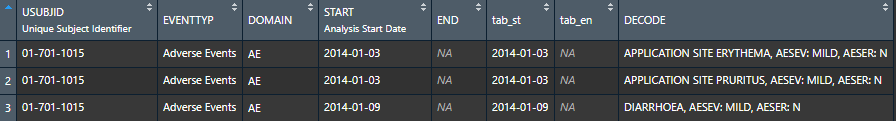
It will always contain these variables, but the amount of rows will
certainly vary. In the example output below, we see that the column
“EVENTTYP” was populated with the df_desc argument. Later,
this will be the Event type label in the timevis object
displayed on the Events tab.
The next column is START which used the “ASTDT” column, which makes
it evident that the ADAE data frame we provided in
mi_datafile (the list of data frames uploaded by the user),
didn’t have the preferred “AESTDT”, so the function selected the next
best date choice: “ASTDT”. It’s important that no matter how many
potential dates you provide in the df_st_date_vars vector,
that at least one of them is a required field according to the current
ADaMIG.
Continuing on, the END variable exists only for date-oriented data
sets that would benefit from seeing a visual start and end of an event.
Typically, “events” happen in one day/ instant. However, an exception to
this would be medical history data where events could include medical
conditions that last several days, months, or years. As such, if you
(the developer) wish to implement new event data that requires showing
the start AND the end of an event, follow the precedent the Medical
History code establishes in the next section called
Build Events. At the end of the day, you just want to
ensure the final output mimics the output above, for reasons that will
also become obvious in the next section.
tab_st and tab_en are just character versions of START and END which play better with DT output tables in the app.
Last, DECODE contains the event description (event_desc)
you want attached to those dates. So, in this instance, the app will
actually display lots of information. Above, the function weaves
together content from 3 different variables using the paste function:
the adverse event itself, it’s severity and seriousness. However, a
single column that summarizes the event would be sufficient. If you (the
developer) want to supply your own static description for an event, you
should include single quotes within your double quotes. For example:
event_desc = "'Headache'". Doing so, will make all your
adverse events take the string ‘Headache’.
Build Events
Now that we’ve organized our data into a standard format, we need to
combine the events the user selects into a singular data frame to be
used in the app. This task is performed in the
mod_indvExp_fct_buildEvents.R file. By browsing this file,
you’ll witness the function just runs org_df_events() on
all the applicable date-oriented data sets currently supported (ADMH,
ADAE, ADCM, ADSL, and ADLB). The only exception to these is the ADSL and
ADMH files, which require custom considerations when building the
standardized data frame shown above. Therefore, if you (the developer)
wish to add another date-oriented data set into the mix, add your new
org_df_events() function. Then, include the name of your data frame
(let’s say it’s called “md_rec”) when creating this list:
uni_list <- list(ds_rec, ae_rec, cm_rec, lb_rec, mh_rec, md_rec)That’s all it takes! A few lines later, uni_list is
rbind-ed into a single data frame (hence the need for uniformity) that
build_events() will sort and return in the app. Once that
data is in the app, it will automatically flow through to the
timevis object on the Events tab or the
Visits tab, if you (the developer) allowed it to do so.
Color Aesthetics
The absolutely last steps is going to be just adjust a few colors
schemes on both the timeviz object on the
Events tab and the plot on the Visits tab.
Why? Because consistency between the tabs will help the users quickly
recognize what type of data they’re observing when the color is always
consistent.
First, to update the colors on the timeviz object on the
Events tab, find the file called
utils_strObjs.R in the R directory. It’s there you’ll find
the following code:
my_cols <- RColorBrewer::brewer.pal(7,"Pastel2")

css <- paste0("
              .nav li a.disabled {
              background-color: #aaa !important;
              color: #333 !important;
              cursor: not-allowed !important;
              border-color: #aaa !important;
              }

              .vis-item.DS { background-color: ",my_cols[1],"; }
              .vis-item.CM { background-color: ",my_cols[2],"; }
              .vis-item.AE { background-color: ",my_cols[3],"; }
              .vis-item.LB { background-color: ",my_cols[4],"; }
              .vis-item.MH_MH { background-color: ",my_cols[5],"; }
              .vis-item.MH_FDH { background-color: ",my_cols[6],"; }
              .vis-item.MH_DH { background-color: ",my_cols[7],"; }
              ")
If you are adding another date-oriented data set, you’ll manually add a new color by increasing brewer.pal’s first argument by 1 (from 7 to 8 in this case). Then, you’ll add another row at the bottom. Continuing with our example, an ADMD would add a row that looks like this:
Similarly, for the Visits tab, you’ll need to add the
name of the new event description to an object called
names2, found in
R/mod_indvExpPatVisits_fct_plot.R, assuming this type of
event is appropriate to overlay on such a plot. Here, we’ve actually
taken the same colors as found in the my_cols vector above,
but tinted them slightly darker so that they are more visible on the
default grey ggplot2 background. Use your discretion whether you should
tint or not. When ready, add the hex digit color to the vector below
called vline_eventtype_cols, in the same element position as in
names2.
# mod_indvExpPatVisits_fct_plot
names2 <- c("Milestones","Concomitant Meds","Adverse Events")
vline_eventtype_cols <- c("#80d1ad", "#f5ae7d", "#a8bde6") # dark version of my_cols
Congratulations! After completing the above steps, you should now have access to the pertinent event/dates information in the app. With any questions, please feel free to reach out to app authors/ maintainers listed in the package documentation.